
How Uber Eats Decreased Defect Rates
The Power of Product–Ops Collaboration: Inside the Data-Driven Playbook That Lowered Errors and Boosted Customer Satisfaction


👋 Hi, it’s Gaurav and Kunal, and welcome to the Insider Growth Group newsletter, our bi-weekly deep dive into the hidden playbooks behind tech’s fastest-growing companies.
Our mission is simple: We help you create a roadmap that boosts your key metrics, whether you're launching a product from scratch or scaling an existing one.
What We Stand For
Actionable Insights: Our content is a no-fluff, practical blueprint you can implement today, featuring real-world examples of what works—and what doesn’t.
Vetted Expertise: We rely on insights from seasoned professionals who truly understand what it takes to scale a business.
Community Learning: Join our network of builders, sharers, and doers to exchange experiences, compare growth tactics, and level up together.
Introduction:
More companies are realizing that to truly shift deeply ingrained behaviors—it requires deep coordination with the operations side of the house.
This expanded collaboration introduces new complexities: more internal stakeholders to align, more processes to streamline, and new challenges in figuring out how an online product can effectively support people working on the ground.
When Engineering, Product, and Design (EPD) teams integrate tightly with Operations, they can deliver end-to-end improvements that actually stick in the real world—driving higher adoption, better retention, and more sustainable growth.
It’s not enough for a PM to just ship digital features anymore. Product and ops used to be siloed—product owned the build, ops owned the rollout and post-launch. But with the rise of large-scale, complex, multi-market products, those boundaries are blurring.
Product teams must work closely with customer success, product operations, and on-the-ground users to ensure that every new feature or process improvement truly addresses real-world needs. This partnership becomes a key part of the Go-To-Market of any product launch.
Today we’ll explore how Uber brought together its EPD teams and operations groups—including drivers, bikers, product operations, and communication operations—to lower the defect rate for Uber Eats.
We’ll dive into three strategic bets that Roy took while at Uber and how he partnered with the Ops team. Without their seamless collaboration, these initiatives wouldn’t have been nearly as successful—perhaps not successful at all.

What exactly is the defect rate for Uber Eats?
Defect Rate is the percentage of orders that run into issues. For Uber Eats, this had a ~7% baseline—meaning 7 out of every 100 orders had some form of problem.
These issues came from two main buckets:
1/ User-Reported Issues
Missing or Wrong Items: Orders with missing items (e.g., that soup was missing) or the entire order wrong (driver delivered wrong bag)
Food Taste or Quality: Spilled soup, a cold burger, or fries that taste stale.
Late Delivery: Couriers who run behind schedule due to high traffic or other delays that lead to a cancellation.
Never Received Order: Eaters who never get their food (courier mix-ups, incorrect drop-offs, etc.).
2/ Non-User-Reported Issues
Driver Courier Shortage: The order is placed but can’t secure a driver or biker, leading to cancellations.
User Didn’t Intervene: Sometimes, an order is canceled or refunded before the eater notices because of internal checks or system flags.
Why does the defect rate matter?
If an eater experiences a defect, they become 10 times more likely to never order again.
> If Uber Eats could improve this metric by 1 basis point this would lead to millions in revenue.
Introducing Roy Frenkiel:

Roy Frenkiel is a seasoned product leader known for turning complex challenges into scalable solutions. As a Director of Product at Uber Eats, Roy owned all restaurant-related technology (onboarding, pricing and packaging, the order tablet, APIs, back-office tooling, payments, and more), part of the consumer app experiences (store page, checkout, fulfillment), and cross-functional efforts (defect reduction). Prior to Uber, he held product leadership roles at Houzz, SoFi, and Medallia, as well as a McKinsey consultant.
Case Study #1: Time-of-Day Menu Adjustments
Context:
Uber Eats noticed that certain restaurant items—particularly those requiring more complex preparation (e.g., McFlurries, fish entrees, soup dumplings)—were more prone to errors during specific shifts. The team identified that high defect rates are correlated to the time of the day the order came in, and the item itself.
The late-night crews faced higher defect rates because of reduced staffing, which created issues during spikes. In addition, certain items faced higher defect rates. The intersection of the two sometimes created dramatic spikes in defects.
Problem:
High Defect Rate on Complex Items: Items like McFlurries and fish entrees had disproportionately high error rates at night.
Operational Strain: Night-shift crews often lacked the support or processes to produce these items consistently, leading to mistakes in preparation and packaging.
Current Solution:
Every item stayed on the menu all day—from restaurant open to close—with no adjustments for time of day or complexity.
New Solution:
To reduce late-night defects, the team introduced time-of-day menu adjustments, removing or hiding complex items during high-risk periods.
They tested this in two phases:
Phase 1: Manual Item Selection
Ops-Driven: Operations teams looked at defect data and identified troublesome items (e.g., McFlurries, certain fish fillets, soup dumplings).
Restricted Availability: These items were removed from late-night menus to minimize errors.
Quick Validation: By limiting the number of advanced items at night, Uber Eats quickly tested whether removing them would lower defect rates.
Phase 2: Model-Driven Automation (Scalable approach which is still in progress)
Predictive Modeling: An ML algorithm identified which items had the highest probability of defects during certain times.
Real-Time Updates: Menus were dynamically adjusted based on shifts in historical data, staffing levels, and ongoing performance metrics.
Scalability: This system allowed for thousands of restaurants to be managed without manual intervention, continually refining itself as it gathered new data.
Roles and Collaboration:
Role Product Played in Phase 1:
Developed and deployed the technical solution to quickly toggle item availability in the app.
Adjusted the ordering system so that menu changes could be implemented in real time.
Coordinated with Ops to ensure that the manual selections could be smoothly integrated within the existing platform.
Role Ops Played in Phase 1:
Analyzed defect data to identify high-risk items (e.g., McFlurries, certain fish fillets, soup dumplings) that were problematic during late-night shifts.
Manually selected and communicated which items should be removed from the night-time menus.
Worked directly with restaurants to give them a heads-up and create targeted training on the new process, ensuring a smooth transition.
Leverage that the Product<>Ops Relationship Provided:
Rapid testing of the hypothesis
Battle-tested Ops by ensuring that restaurants were prepared and supported, setting the stage for a significant reduction in defect rates.
Impact:
20 bps Reduction in Defect Rate: Removing high-risk items during night shifts significantly lowered total defects.
Reducing the number of items on the menu led to a small drop in basket size and conversion rates, but the substantial decrease in defect rates more than made up for that loss.
Learnings:
Pilot ideas with the Ops team before investing EPD resources: Leveraging Operations teams to validate the concept before investing in an automated, scalable solution can be a toolkit for a PM.
Context is Everything: The same menu item can perform flawlessly at noon but fail at midnight. Tailoring product availability to operational realities—like staffing or traffic patterns—helps you move metrics.
Defining Data Definitions Upfront: Agreeing on what “complicated” means at the beginning of a project prevents confusion and misalignment across teams. Additionally, relying solely on human judgment from operations can introduce selection bias. Establishing a standardized, randomized decision framework ensures it’s consistency throughout the project.
If you’ve gotten this far, you may be ready to navigate to the 🔥 section and check out our Playbook now.
Case Study #2: Optimizing Multi-Location Restaurant Selection
Context:
Uber Eats aims to provide users with the best combination of availability, price, and speed. In dense urban areas, a single restaurant brand (e.g., McDonald’s, Starbucks, Chipotle, etc.) may operate multiple locations within short distances. The Uber Eats app would always default to the closest restaurant within that chain to the user, minimizing delivery time.
Problem:
Uneven Quality Across Locations: Not all locations within a restaurant chain are the same—sometimes the closest one may have higher defect rates or slower service. Previously, Uber focused solely on proximity, but to truly improve the customer experience, orders should come from the best-performing location rather than just the nearest one.
Overemphasis on Distance: By focusing on proximity alone, the system ignored the quality metrics that could significantly reduce defect rates.
Current Solution:
Default to Nearest Location: Because all locations in a given area share similar menus and pricing, Uber Eats prioritized minimal travel distance to get it to the end user as fast as possible.
New Solution:
The team introduced quality-based store selection, factoring in both distance and historical defect data to guide users to a more reliable location—even if it wasn’t the absolute closest.
Algorithmic Changes
The app evaluated each potential store on delivery time and quality metrics (e.g., missing item rate).
A small, additional travel time could be justified if the store offered a significantly lower defect probability.
Power of the Default
For the eater, the restaurant with the best composite score (distance + reliability) became the default choice.
Users could still opt for a different location, but most stuck with the default, naturally improving overall defect rates.
Operations:
Partnered with product operations to gather defect data, pinpoint the root causes behind higher rates, and then share these insights with HQ—enabling them to revise processes for underperforming restaurant chains.
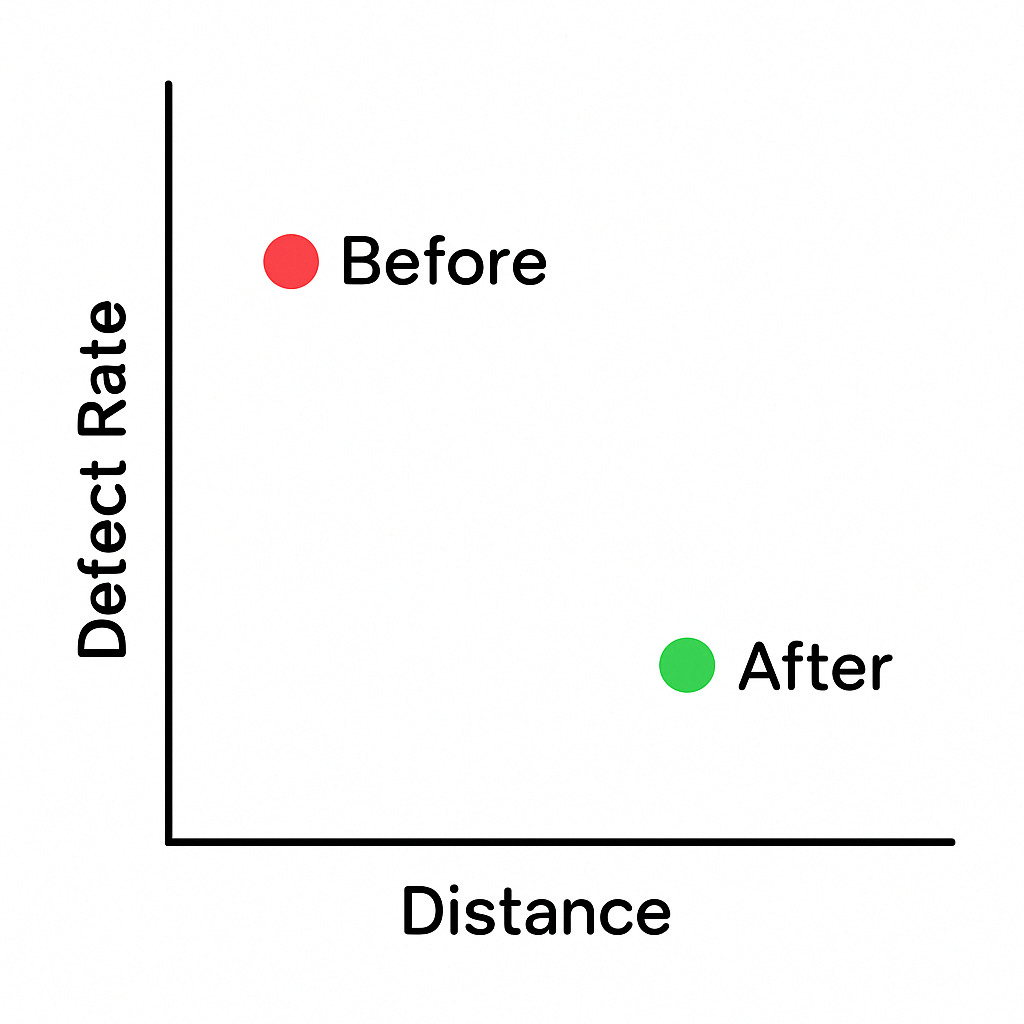
How the algorithm changed before vs. after:
Roles and Collaboration:
Role Product Played:
Developed and integrated an algorithm that combined distance with quality metrics to default orders to the best-performing location.
Updated the user interface to highlight the optimal location while still allowing users to select alternate options.
Role Ops Played:
Collected and analyzed defect data from various locations and provided real-world insights on local performance differences.
Standardized quality metrics and communicated key operational factors to headquarters for process improvements.
Leverage that the Product<>Ops Relationship Provided:
This real-time integration not only optimized the ordering process and reduced defect rates, boosting revenue for Uber, but also empowered HQ to address systemic issues at underperforming locations by tackling the root causes of recurring problems.
Ops standardized and validated quality metrics by analyzing real-world performance. This enabled the product team to fine-tune the composite scoring system so that it balanced both proximity and reliability, ensuring that orders were routed to the best-performing branch.
Impact:
5 bps Reduction in Defect Rate: By nudging users toward more reliable locations, missing-item complaints and delivery errors decreased.
Optimizing store selection based on quality resulted in a slight increase in cost per trip and a minor uptick in late arrivals but the significant reduction in overall defect rates outweighed the increase in costs.
Learnings:
Power of the Default: Changing the pre-selected location drove a measurable reduction in defects, underscoring how defaults significantly influence user behavior.
Leaning on Operations Teams for Early Research: By going beyond raw data, operations teams can share nuanced, local insights—such as changes in management or on-site training improvements—that help pinpoint the true causes of higher defect rates.
Case Study #3: Improving Visibility and Communication for “BYOC” Restaurants
Context:
In large parts of Europe, many restaurants use their own delivery couriers (like Domino’s in the US), to deliver food, which they use for Uber Eats orders as well. This is referred to as “Bring Your Own Courier” (BYOC). Under this model, the restaurant prints out order delivery details, including the eater’s address, and its in-house courier then manually inputs the address into a separate navigation tool (e.g., Google Maps). These couriers aren’t integrated into the Uber system, so Uber can’t track their location or facilitate direct communication with customers.
Problem:
BYOC orders had 2x higher “Never Received Order” defects than couriers using the Uber app. Because these external couriers operated “offline,” neither Uber nor the eater knew where the courier was in real time. Couriers also couldn’t directly message eaters to confirm delivery details, or enjoy the guidance from Uber such as on building entry points
Current Solution:
When an order came in, the workflow was fully offline:
Order Print-Out: The restaurant’s in-house system printed an Uber Eats order ticket with the customer’s details and address.
Manual Address Entry: The courier read the printout and typed the address into a separate mapping service (e.g., Google Maps).
Order Drop-off: Courier would drive to the user’s address and drop it off.

New Solution:
To address these pain points, Uber introduced a QR code that integrated external couriers into the Uber platform alongside operations incentives to encourage adoption.
QR Code Integration
Each order receipt printed by the restaurant would have a unique QR code.
Scanning it launched the Uber driver app with the address pre-loaded.
Couriers gained real-time tracking and could communicate with customers directly.
Operational Incentives
Marketplace Fee Discounts: Restaurants that adopted QR scanning were rewarded with lower fees, offsetting any perceived hassle of changing their courier workflows.

Jobs to be Done:

Roles and Collaboration:
Role Product Played:
Developed and integrated a QR code system that printed unique codes on order receipts, allowing couriers to automatically launch the Uber driver app with preloaded delivery details.
Built real-time tracking and in-app messaging features to bring offline BYOC operations into the Uber ecosystem, streamlining route navigation and issue resolution.
Role Ops Played:
Worked directly with restaurants to roll out the QR code solution, providing training and support to ensure their in-house couriers adopted the new workflow.
Implemented change management initiatives, including operational incentives such as marketplace fee discounts, to drive adoption and boost confidence in the new process.
Leverage that the Product<>Ops Relationship Provided:
The product team’s technical solution required Ops’ on-the-ground insights to tailor the QR system for real-world BYOC challenges (i.e printer compatibility) —ensuring that external couriers could transition smoothly into the digital workflow.
Ops’ proactive engagement with restaurants and couriers turned a low initial adoption (1.5%) into a successful rollout, by creating clear, tangible incentives and providing hands-on training.
Impact:
35 Basis Point Defect Reduction in BYOC merchant adopting the solution: With more couriers scanning and using the Uber app, defect rates dropped significantly for these merchants.
Learnings:
Operational Incentives are Vital: The initial release had a very low adoption rate of 1.5% but combining it with incentives that the on the ground operations teams rolled out it created a tangible motivation for restaurants to train couriers on the new workflow.
Bridging Offline and Online: Incorporating more of your users’ offline activities into your product benefits both the company and the users themselves, creating a seamlessly connected workflow.
🔥 Insider Growth Playbook: Leverage the Product-Ops Relationship to increase your Go-To-Market Velocity and Confidence
When a feature release involves multiple operational steps or offline processes, it is essential to partner with your Ops team. If your feature is part of a multi-step process spanning various operational functions, collaborating with Ops is critical to determine its true impact and resolve potential issues.
Step 1: Evaluate Your Process Complexity
Identify areas where your feature relies on coordination among multiple operations teams or involves offline processes.
Recognize that these components require Ops involvement to ensure smooth execution and accurate measurement of outcomes.
Step 2: Understand the Impact of Not Partnering with Ops
Without Ops collaboration, you risk missing key insights and may not be able to gauge whether your feature delivers the intended impact.
Lack of operational input can leave root issues unaddressed, negatively affecting overall performance and revenue.
Step 3: Extended User Research & Validation
Partner with Ops to conduct comprehensive research with internal operator personas and front-line teams.
Use their on-the-ground insights to understand the full scope of the process, including manual data entry, physical workflows, and inter-department handoffs.
Step 4: Run Pilots Led by Ops
Implement targeted pilots managed by Ops to test how the feature performs in real operational conditions.
Use these pilot tests to refine the solution before scaling up, ensuring the process is validated and optimized.
Step 5: Alpha and Beta Tests During Release
Combine technical tracking from the product side with operational feedback during controlled alpha and beta tests.
This dual approach ensures that any issues are identified early and adjustments can be made in real time.
Step 6: Post-Launch Analysis & Continuous Feedback
Conduct a thorough post-launch review in partnership with Ops, analyzing how the feature performed against operational metrics.
Establish a continuous feedback loop to integrate Ops insights into ongoing improvements, addressing root causes and enhancing overall outcomes.
How Each Function Leads & Owns Their Part:
Ops Responsibility:
Leverage their deep understanding of internal operator personas and real-world processes to identify friction points and standardize workflows.
Provide critical, actionable feedback on on-the-ground operational challenges.
Product Responsibility:
Use Ops insights to define feature requirements and balance enhancements across the user journey with technical feasibility.
Make data-driven decisions that ensure the solution is robust, seamlessly integrating operational needs.
By following this playbook, you not only improve the impact of your feature but also bridge the offline-online gap, solving root issues and driving significant revenue growth.
Want help on any product growth challenges you have?
Let’s talk