


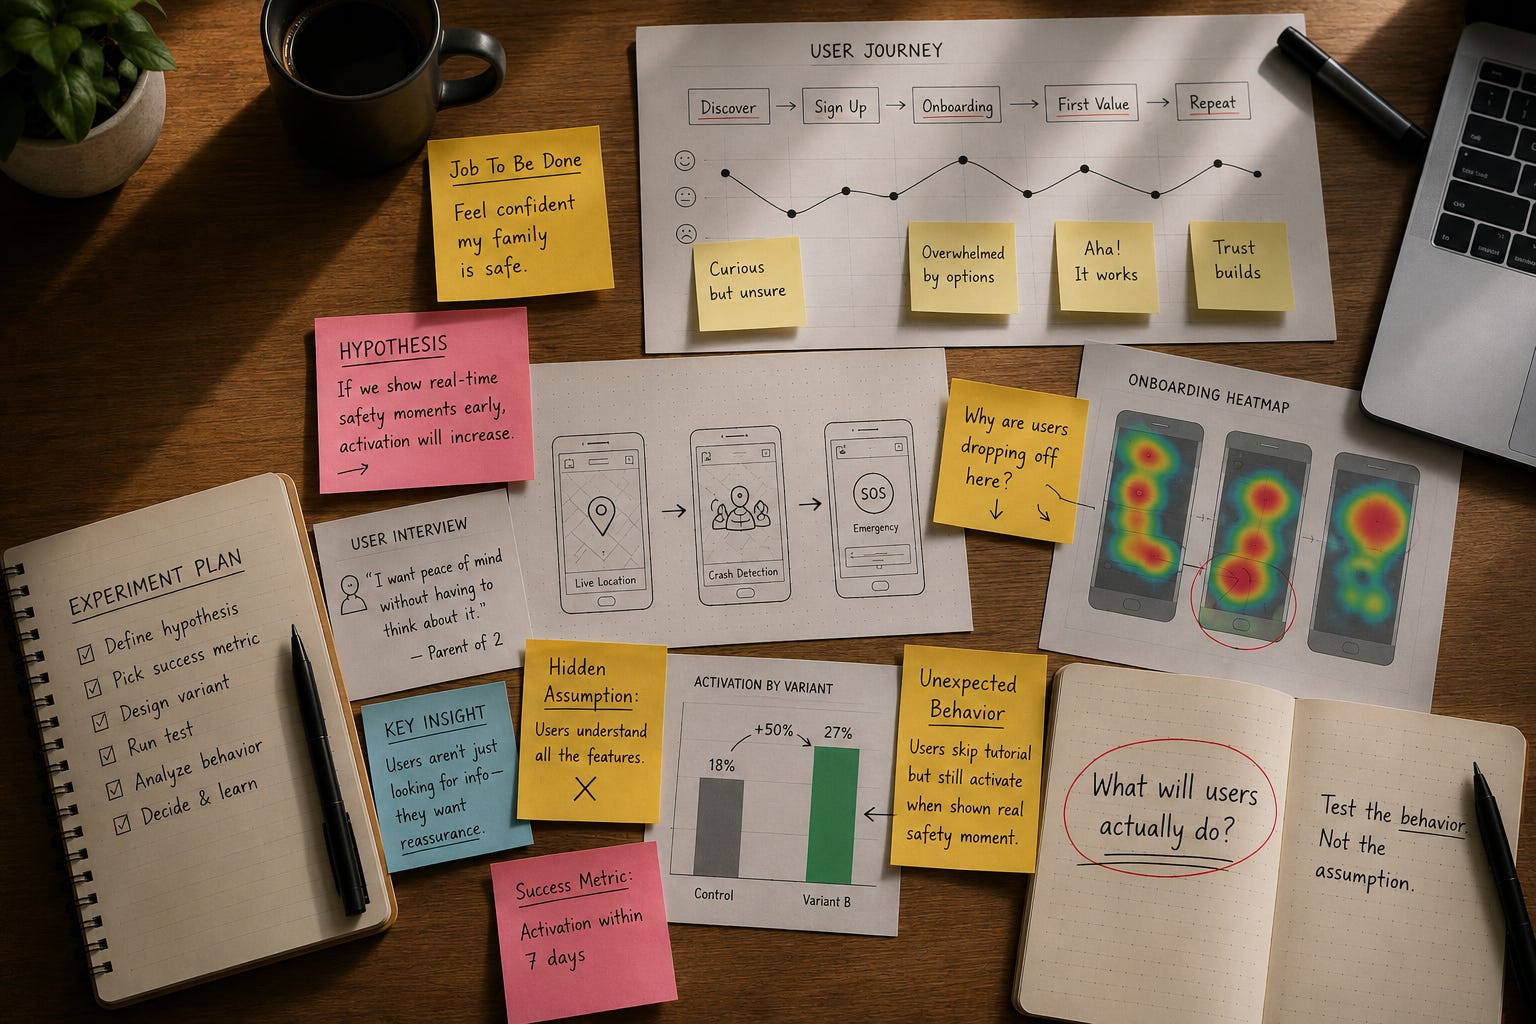
👋 Hi, it’s Gaurav and Kunal, and welcome to the Insider Growth Group newsletter, our bi-weekly deep dive into the hidden playbooks behind tech’s fastest-growing companies.
Our mission is simple: We help you create a roadmap that boosts your key metrics, whether you're launching a product from scratch or scaling an existing one.
What We Stand For
Actionable Insights: Our content is a no-fluff, practical blueprint you can implement today, featuring real-world examples of what works—and what doesn’t.
Vetted Expertise: We rely on insights from seasoned professionals who truly understand what it takes to scale a business.
Community Learning: Join our network of builders, sharers, and doers to exchange experiences, compare growth tactics, and level up together.
Who should read this: This piece is for product managers, founders, and growth leaders who have ever shipped a feature with full confidence and watched it fail anyway. If you work at a company where experiments are expensive and a wrong bet costs you a quarter.
Introduction
How many times have you shipped a feature you were confident in, only to watch adoption stall, the metric flatline, or worse, lose to the control?
If you’ve launched products, the answer is “more times than I want to admit.” And the reason is almost always the same. You did not understand the user problem well enough before you built the solution. The hypothesis felt obvious. Everyone agreed. Then it shipped, and the data told a different story.
This problem is getting worse. AI has collapsed the cost of shipping. A feature that took a team six weeks to build now takes one engineer a weekend. Cursor, v0, and Claude Code have made “build it and see” almost free. Which means the bottleneck has moved. The expensive part is no longer the build. It is choosing what to build.
This is why every product leader on Lenny’s podcast is suddenly talking about “taste” and “judgment.” Cat Wu, who leads Claude Code at Anthropic, called taste the single most important skill for PMs in the AI era on a recent episode. We agree with taste and judgment becoming the new skill set, but not with how it’s being communicated. “Taste” and “Judgment” are not built on vibes. Taste is not a feeling. In the product context, taste is the ability to predict how users will actually behave and use the feature before you spend resources finding out. It is hypothesis confidence at the moment you decide what to build.
PMs with good taste are not making lucky guesses. They are running better validation, faster, with more rigor, and arriving at the bet with higher confidence than the room.
Every feature you ship rests on a hypothesis about how users will behave. Get that one thing wrong and nothing downstream saves you. Not clean design, not strong engineering, not a flawless rollout.
Ron Kohavi, who ran experimentation at Microsoft and Bing for over a decade and is the most-cited researcher in the field of online A/B testing, has published that only about one-third of experiments at mature tech companies move the target metric in the intended direction. Another third are flat. The final third actually hurt the metric. Booking.com, which runs one of the largest experimentation programs in the world, has reported similar results publicly. Harvard Business Review’s coverage of product launch outcomes puts overall feature failure rates between 60 and 90 percent depending on category. The build was never the expensive part. The wrong hypothesis is.
This is not a discipline problem. Every common way to test a hypothesis breaks the same way. Landing pages and paid ads measure clicks, not behavior. Surveys and interviews capture what people say, which is rarely what they do. Customer success signal arrives pre-filtered by your loudest accounts. Betas draw your least typical users. Each has a place. None of them show you real behavior, at scale, before you have spent weeks aligning and building.
So you do what you have always done. You gather imperfect signal, form a hypothesis that feels right, and ship.
Two years ago we wrote about the Litmus Framework, a way to prioritize growth bets using napkin math, resourcing impact, revenue risk, and exec buy-in. It was designed to help teams build confidence in their testing roadmap and rank bets by their likelihood of moving the needle. What it could not do was validate the underlying hypothesis about user behavior before the experiment shipped. That is the gap this article is about.
Litmus 1.0 was built to help teams prioritize faster with more confidence given the information available at the time. It worked because it forced napkin math and honest resourcing estimates into decisions most teams were making on gut feel alone.
Litmus 2.0 does not replace that. It extends it. AI has given product teams an additional method to gather signal on their hypothesis before a single sprint is committed - behavioral simulation being one example. That new signal deserves a place in the prioritization formula. So we add one variable: Hypothesis Confidence. The question it forces is simple: how sure are you that your assumption about user behavior is actually right, and what evidence do you have beyond what users told you?
This post is about what to do when it is not. At Uber, one wrong hypothesis burned months of work and millions in bookings. It was not a bug. The hypothesis was simply wrong, and no one could have known until it reached millions of people.
We will walk through the bet that failed at Uber, how we would run it today, an additional team that caught the mistake before building, and an updated Litmus framework for the AI era.
Meet Nicole Orsak

Nicole studied engineering at Stanford, then spent nearly four years as a product manager at Uber, most of it on the Uber Eats Offers and Affordability team, where she ran experiments that drove more than $1 billion in redeemed value. Before Uber she built product at Twitter and Disney+.
She started Tenera because she lived the problem at scale. AI made building cheap and fast, so engineering is no longer the bottleneck. The hard part is knowing what to build. Tenera puts research signal right at the moment you decide, so you can test how users will actually behave before you build, and validate in minutes instead of weeks. Backed by a16z Speedrun, and already used by PMs at Uber.
A Quick Primer: What Is Behavioral Simulation?
If you have not heard the term before, you are not alone. Behavioral simulation is the technical name for a new category of product validation that has emerged in the last two years, and most PMs have not encountered it yet.
Already familiar with behavioral simulation? Skip ahead to the case studies → 📚
Here is what it is and how it works.
The one-sentence definition. Behavioral simulation creates digital versions of your real users, then watches how they would behave inside a version of your product, before you build it.
You are creating a simulated population that matches your real user base and observing their decisions inside the experience you are considering shipping.
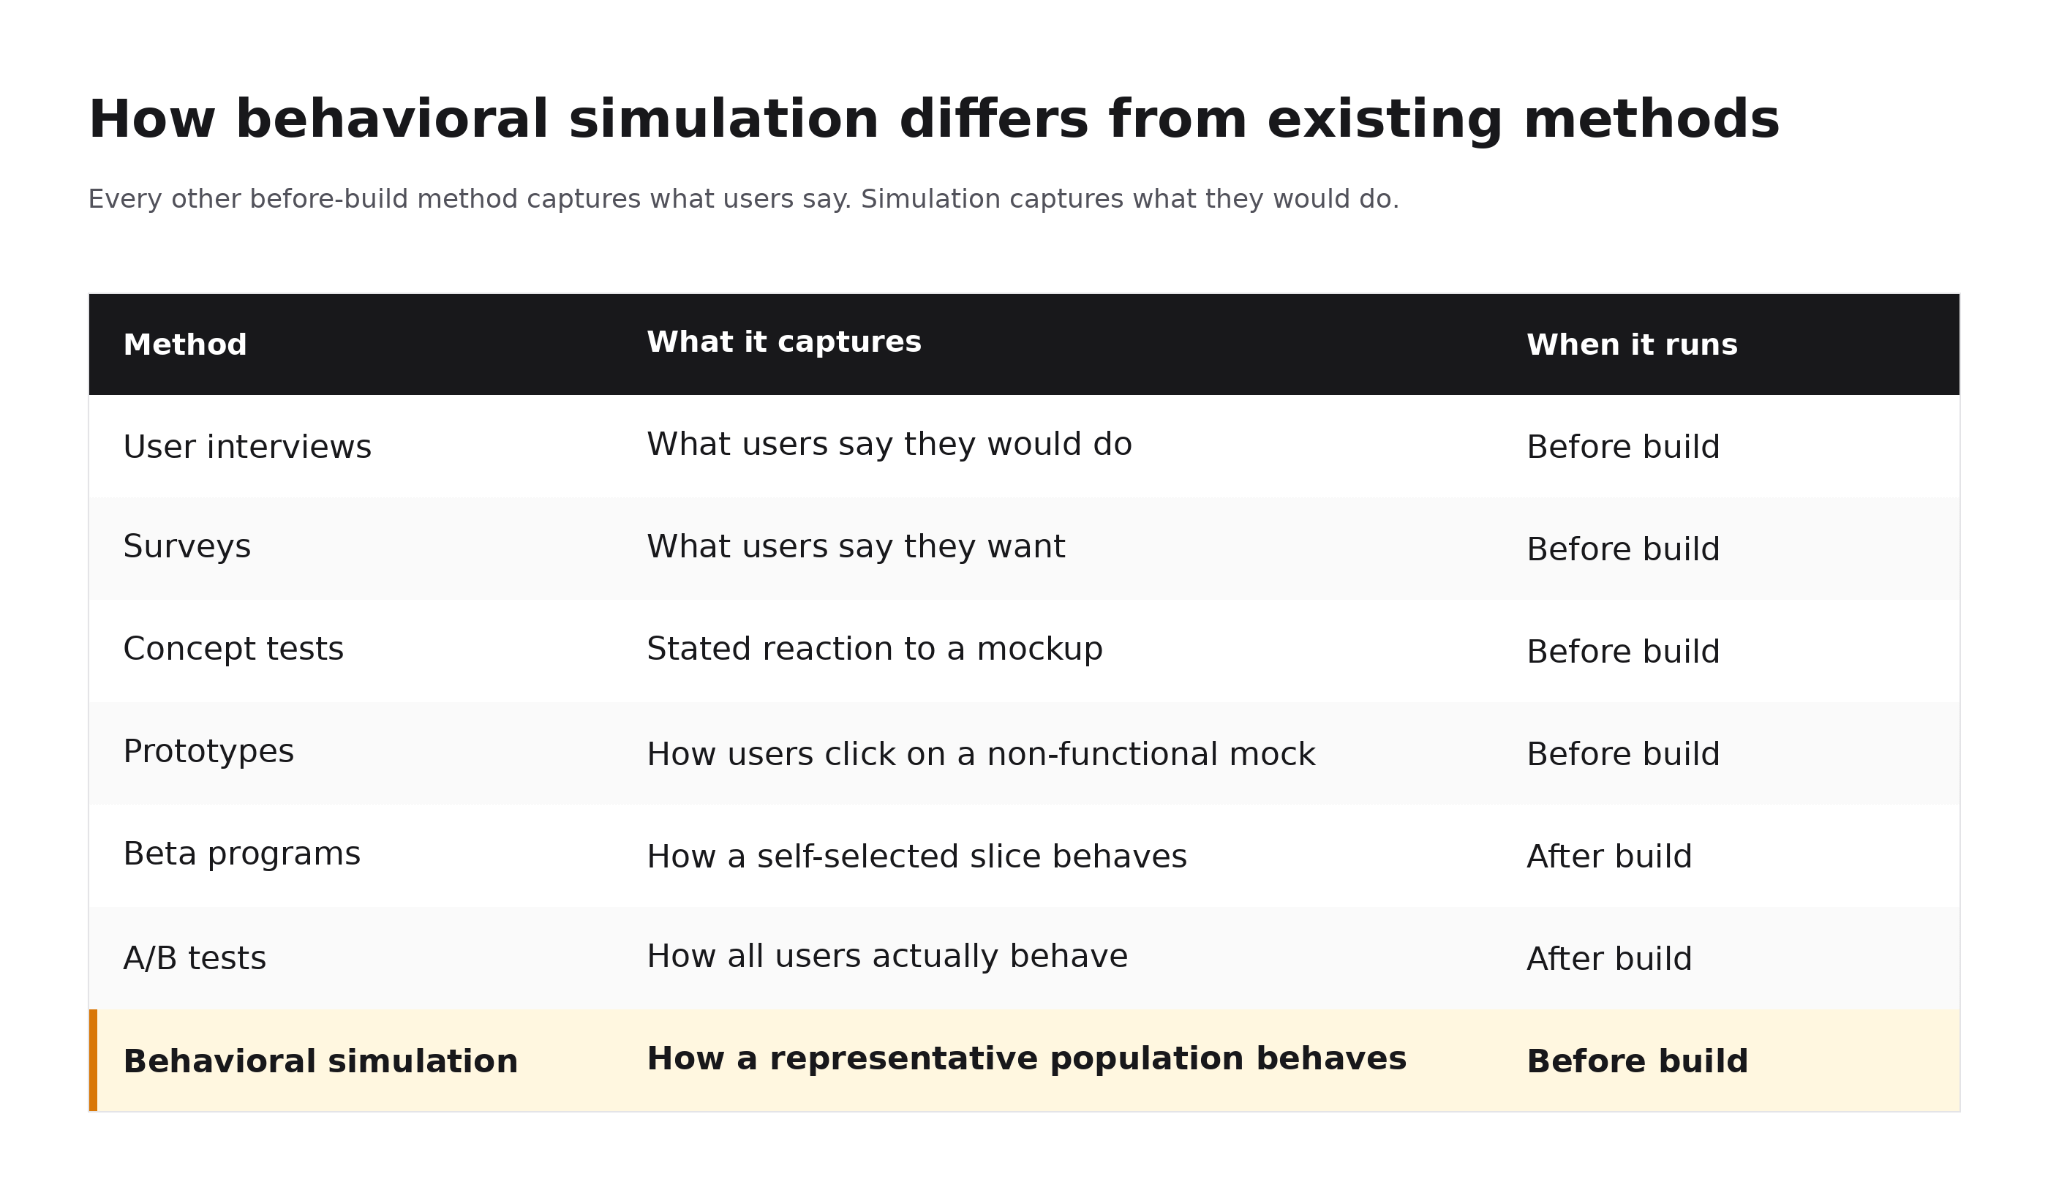
Every other “before build” method captures stated preference. The user is telling you what they think they would do. Behavioral simulation captures revealed preference. The simulated user is making decisions the way your real users make decisions, because the simulation is grounded in how your real users have behaved historically.
How does it actually work, in plain English?
There are four ingredients.
1. Your historical user data. Past experiments, clickstream, funnel behavior, conversion patterns, cohort splits. The simulation reads this to learn how your specific user base actually behaves.
2. A simulated user population. A model generates a synthetic population whose decision making mirrors your real user distribution. If your real users skew toward price-sensitive families ordering on weekends, your simulated users do too. They are statistical shadows of your actual base.
3. A low-fidelity version of the proposed product. This can be a description, a mockup, or a lightweight rebuilt surface. The simulated users interact with it the same way they would interact with a live product, by making choices.
4. A behavioral log. Every choice each simulated user makes gets recorded as an event, the same way your real production analytics would log a click. The output is a clickstream you can analyze with the same tools you use for live data.
You then read that simulated clickstream the way you would read a live one. Which step had the biggest drop. Which cohort behaved differently. What guardrail metric moved.
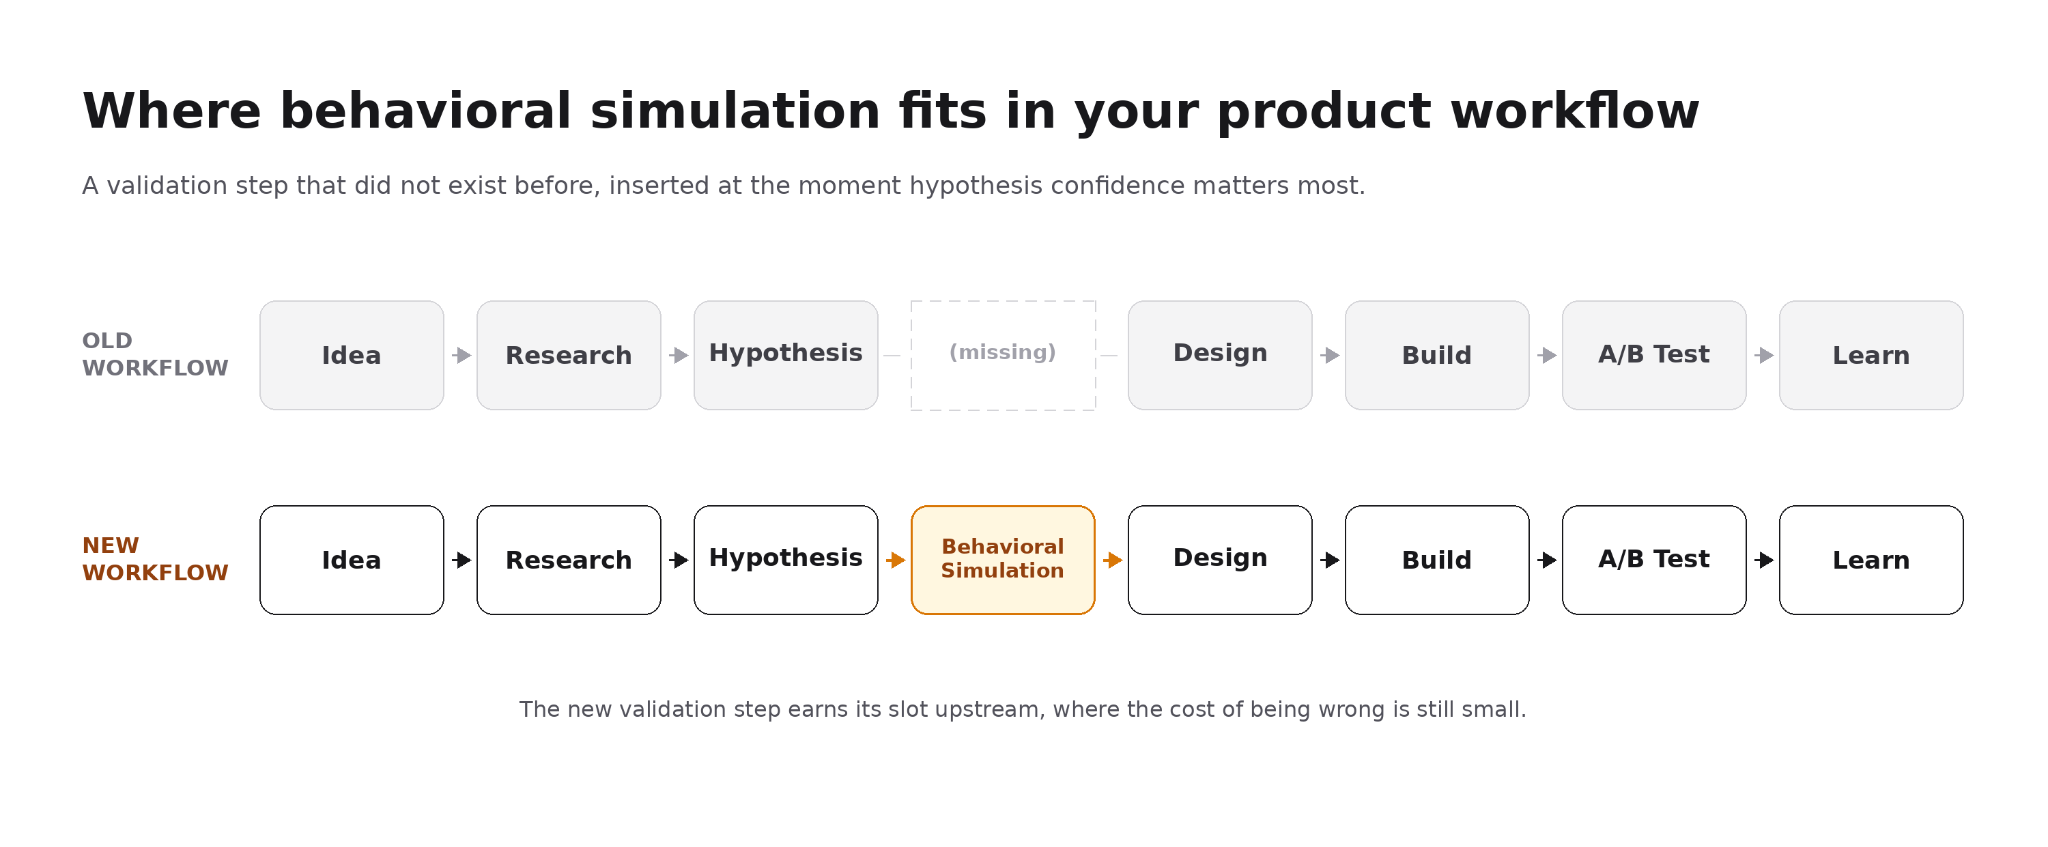
Where does it fit in your workflow?
It sits in a slot that did not exist before, between hypothesis formation and the commitment to build.
Important caveat: Behavioral simulation is a young category. The simulation is only as good as the data you feed it and the question you ask it. If your historical data is thin, biased, or from a different user population than the one you are targeting, the simulation will reflect that. It is not a shortcut to the right answer. It is a way to stress-test a hypothesis against the data you already have, earlier and cheaper than a live experiment. Use it to sharpen the question, not to replace the judgment call.
In practice, you would use it when:
The bet is big enough that being wrong costs more than the validation effort
The hypothesis is about user behavior, not about technical feasibility
You have historical user data to ground the simulation in
A live A/B test would take weeks or months to read out
You would not use it when:
You are building a brand new surface with no user history (use a live test or a prototype instead)
The decision is about technical performance, not user behavior
The hypothesis can be settled by a quick data pull
Simulation confidence lives or dies on one question: is the data behind it actually representative of your real users?
Before you trust any simulation output, check three things:
Is the historical data recent enough to reflect how your current users behave?
Does the user population match the users who will actually see this experiment?
Is the sample large enough to be meaningful?
If yes to all three, treat the output as a real signal. If no to any of them, discount it the same way you would a user research study with a biased sample.
Here is how a well-built simulation earns that trust.
Grounding. Simulated users are not generic AI personas. They are built from your own data — historical behavior, clickstream distributions, prior research, and real customer segments. If your real users skew toward price-sensitive families ordering on weekends, the simulated population does too.
Simulation. The product surface is recreated, including the new version being tested. Simulated users move through it the way real users would — clicks, scrolls, hesitations, exits. The system predicts the most likely next action at each step, then uses consensus across multiple models to interpret why that behavior is happening and where the edge cases are.
Validation. Before relying on a simulation for a real launch decision, test it against your own history. Take decisions you already shipped, run the simulation as if the outcome were unknown, and compare the prediction against what users actually did. That gives you a measurable accuracy number on unseen data.
It is a pre-launch behavioral wind tunnel: a way to expose likely friction, compare variants, and understand what broke, where it broke, which segment was affected, and what to fix, before real customers are touched.
📚 Case Study 1. The Checkout Experiment that failed in a week
Context
Uber Eats had a conversion problem at checkout. When a user added an item with a promotion attached, a buy one get one or a percent off offer, conversion from cart to checkout dropped, even though the user was saving money. When fees made up a larger share of the total, checkout conversion fell from around 65 percent to as low as 25 percent. Millions of carts flow through this surface every week, so the team had one job. Find out why, and fix it.
This is not a story about a team that made a mistake. It is a story about a process that gives every product team the same blind spot.
Problem
You open Sweetgreen on a Tuesday night. A Harvest Bowl, normally $14, has a “Buy One, Get One 50% off” badge on it. You tap it. You add a second bowl for your partner. The cart shows your $21 subtotal, looking like a steal. You hit checkout.
Now the screen shows the $21 subtotal, then a $4.99 service fee, a $3.99 delivery fee, $1.85 in tax, and a tip line. The total climbs to $34. The fees, calculated off the original pre-discount subtotal, now look enormous next to the savings you were just celebrating. The deal you thought you got is suddenly the smallest number on the screen. You hesitate. You close the app.
That was the team’s working hypothesis. Sticker shock. When an eater adds an item promotion, the discount lands on the item, but service fees still get calculated off the original subtotal. So at checkout, the user sees a great-looking item price, then a fee line that looks oversized next to the new lower subtotal. The fees feel punishing, so the user leaves.
Everything pointed this way. Funnel data linked high-fee shares to lower conversion. Research kept surfacing the same complaint about fees and transparency. The whole industry agreed junk fees were the enemy. It felt less like a hypothesis and more like a fact.
Solution
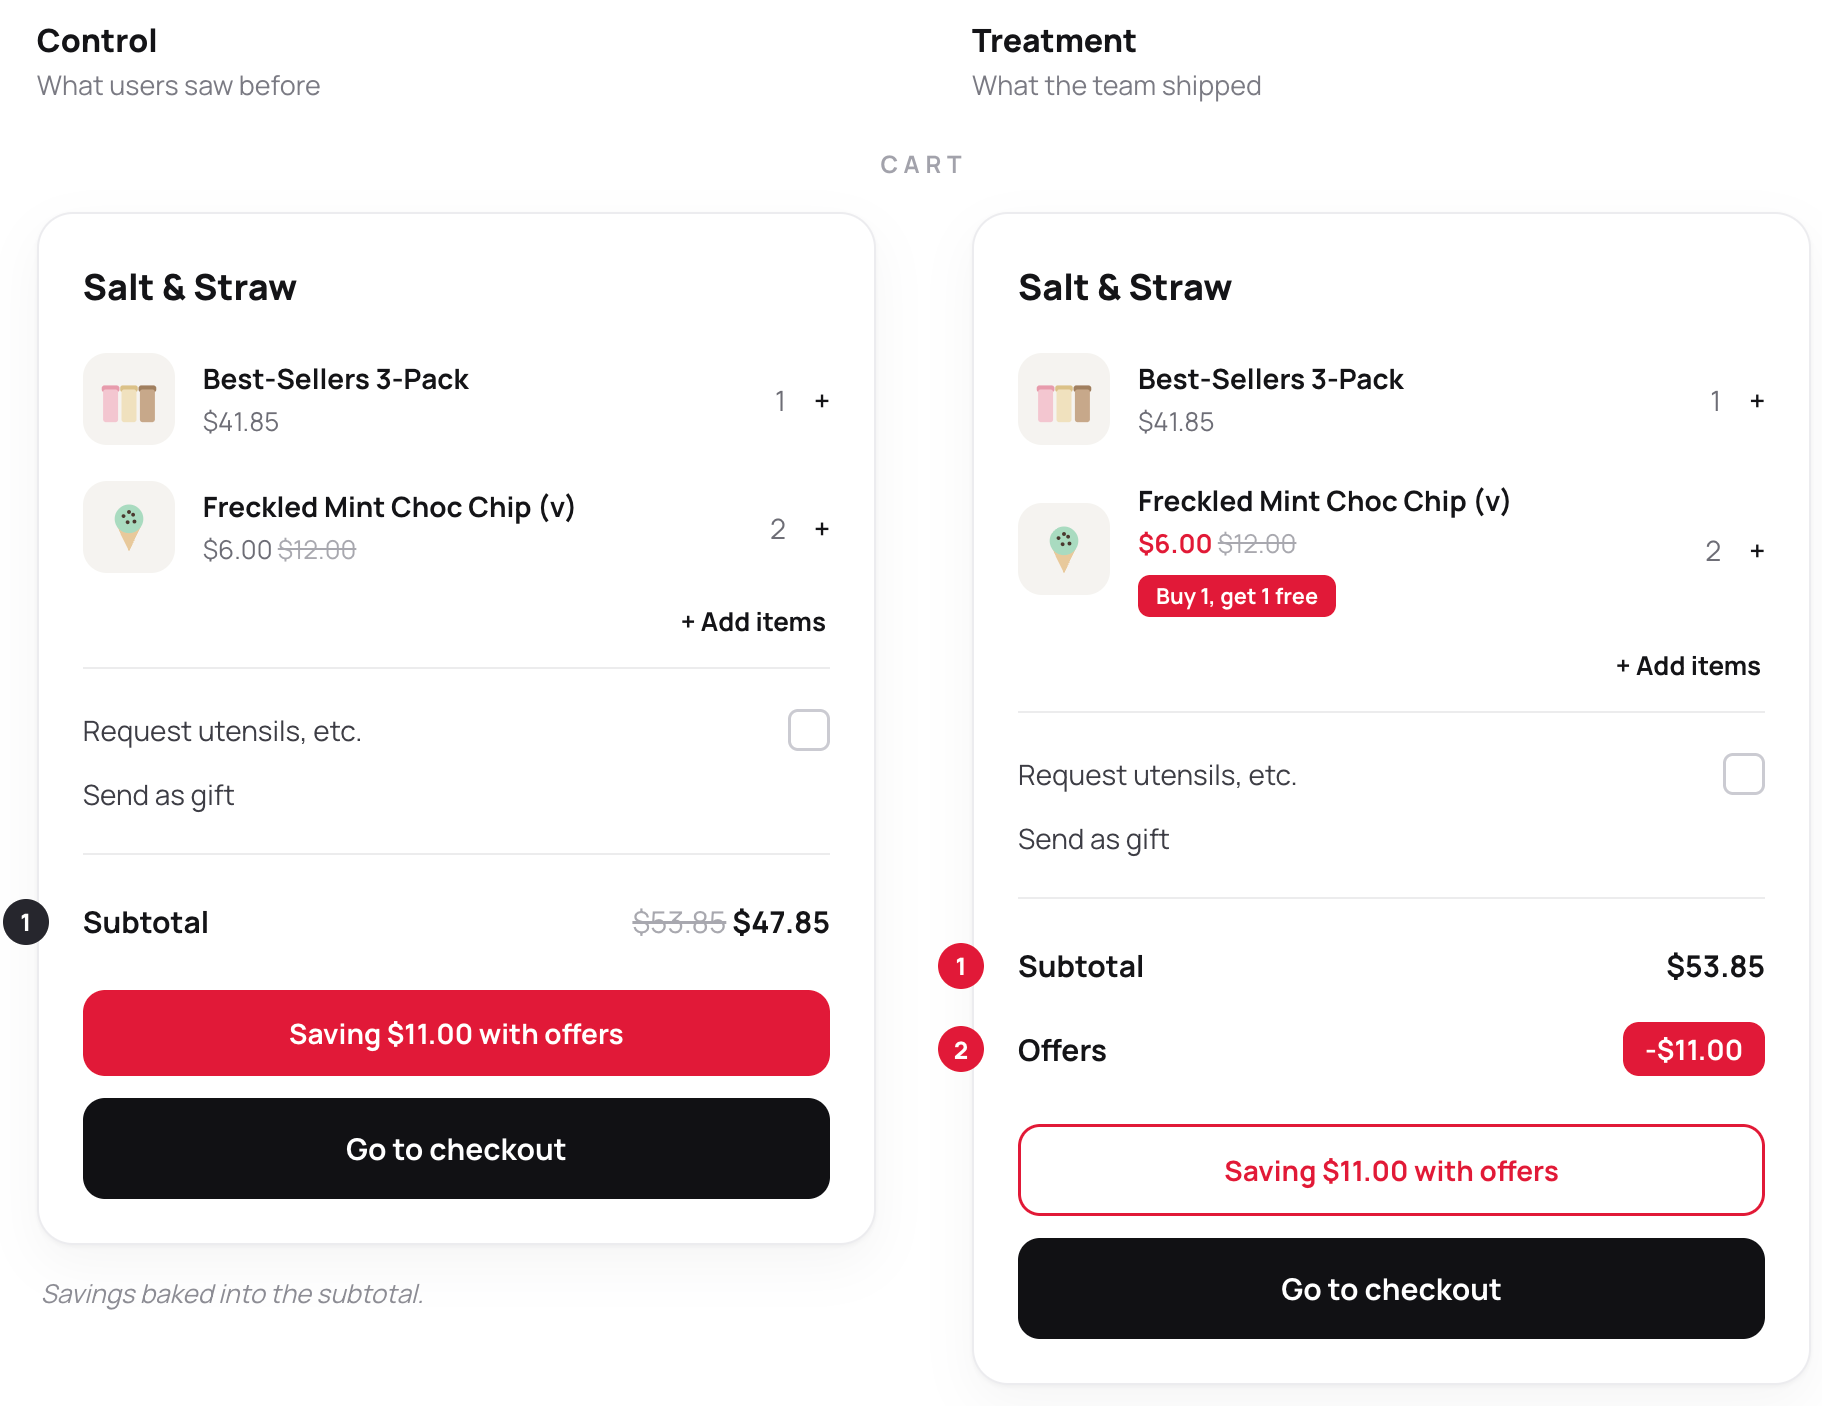
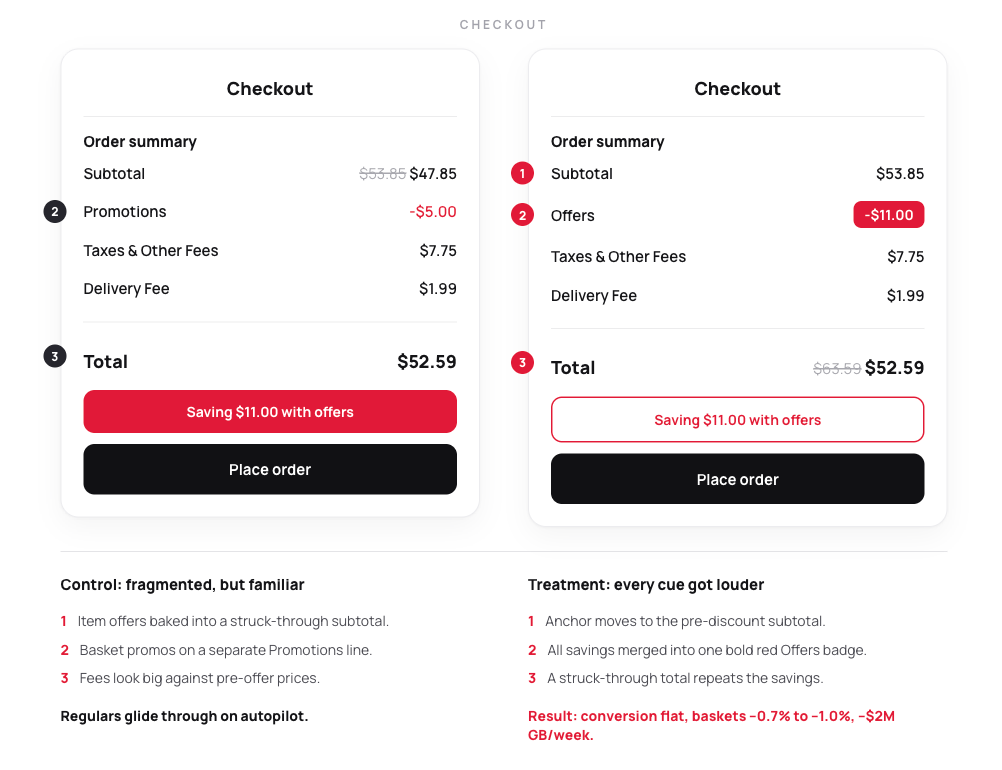
The team rebuilt the cart to checkout pricing experience to kill sticker shock. They combined all promotions on food items into one bold savings line, moved fees so they read as proportional to the discounted total, and tagged the discounted items on cart. Make the deal feel like a deal, make the fees feel small, and the abandonment should disappear. They ran it against the control in a test planned to last a month.
Cart view - Control (left) vs. Treatment (right). The treatment surfaces the discount at the item level with a strikethrough price and "Buy 1, get 1 free" badge, and breaks out offers as a separate line in the subtotal.
Checkout view - Control (left) vs. Treatment (right). The treatment anchors to the pre-discount subtotal, merges all savings into one bold red Offers badge, and strikes through the original total. Every savings cue got louder.
Impact
The target metric never moved. The team lost roughly $2 million in a week.
The team killed it after one week, because the treatment was actively losing money. And here is the strange part. Checkout conversion came back flat across every variation. The fix did nothing, because sticker shock was not what drove the behavior in the first place.
What moved was the thing no one was watching. Basket size dropped about 1 percent. Gross bookings fell about half a percent, roughly $2 million in a single week. The redesign had pushed savings, struck through prices, and a loud discount story, and it looked like it had turned a food ordering moment into a deal hunting one, where users trimmed their carts and ordered less.
The team pulled the experiment and ran a postmortem. The real driver was a shift from habit to evaluation: Control let frequent users breeze through a familiar “finish ordering dinner” flow, while the treatments made them stop and verify the deal, the total, and whether they were still getting the value they expected. In practice, that turned a fast checkout into a quick shopping decision, which created hesitation and trust checks even when the UI looked cleaner on paper.
At Uber’s scale, $2 million is a rounding error. Checkout is one of a handful of surfaces where a single point of conversion is worth nine figures a year, and the team gave up its slot for a quarter, along with the time of a PM, a designer, a data scientist, and a pod of engineers.
Learnings
The obvious hypothesis gets the least scrutiny: sticker shock had funnel data and an entire industry behind it, and that agreement is exactly what made it dangerous.
Knowing why an experiment failed is not enough on its own. The team landed on the right driver habit versus evaluation but without having validated that hypothesis upstream, they had no clean next experiment to run. The insight existed. The confidence to act on it did not. That is the difference between a postmortem that produces a direction and one that produces a guess.
The build was never the expensive part: the wrong hypothesis was, and so was the silence after it.
How Nicole Would Run It Today
The failure was not in execution, and it was not unique to this team. The flow was designed well, the experiment was clean, and the postmortem was thorough. What was missing was a discipline for stress-testing hypotheses upstream before the build. Nicole recognized this pattern not just from this experiment but from watching it repeat across surfaces and teams at Uber.
Step 1. Write the hypothesis with the guardrail metric inside the sentence. Not “users have sticker shock.” Instead: “Users abandon because the gap between cart total and final total feels like worse value, and closing that gap will lift conversion without hurting basket size.” That single sentence puts basket size on the watch list before launch, not after. It is the one edit that would have caught the failure mode the team missed.
Step 2. Stress test the hypothesis against historical behavior before any design work. Pull the cohort that drops at checkout when fees are a big share of the total. Then look at what else is different about them. Are they higher-AOV users? Are they ordering at peak hours when delivery times are longer? Did they previously place an order through a different surface? You are looking for the second story the data tells, not the first. If basket size or session time tells a different story than conversion does, that is your real lead.
Step 3. Use behavioral simulation to pressure test the build, not just the build’s hypothesis. Before writing engineering tickets, rebuild the proposed treatment as a low-fidelity surface and run it against simulated users grounded in your real clickstream. Watch what they do, not what they say. The point is not to predict revenue. The point is to catch the second-order effects, the ones that show up in basket size or order frequency, before you ship.
Step 4. Reframe the problem once the real driver is visible. Here is what the simulation would have likely shown: the issue was never how fees were displayed. It was about who was seeing the deal story, and when.
Think about how a frequent Uber Eats user actually orders. They open the app, they know what they want, they tap through checkout on autopilot. It is closer to muscle memory than a shopping decision. Now you put a loud savings banner in front of them - bold strikethroughs, a “YOU SAVED $7” callout, the whole thing. Suddenly they are not ordering anymore. They are evaluating. And the moment someone starts evaluating, every item in the cart gets scrutinized. The drink. The side. The dessert. Is this still a good deal? Maybe I will just get the bowl.
They did not abandon. They optimized. That is why conversion stayed flat while basket size dropped.
The insight: loud savings framing is a selling tool for someone still deciding whether to order. It is a basket-shrinking tool for someone who already has.
So the problem was never the fee breakdown. It was that the team was running a deal story on the wrong audience.
Step 5. Ship with calibrated confidence. With the real driver named, you now have two focused experiments instead of one expensive guess:
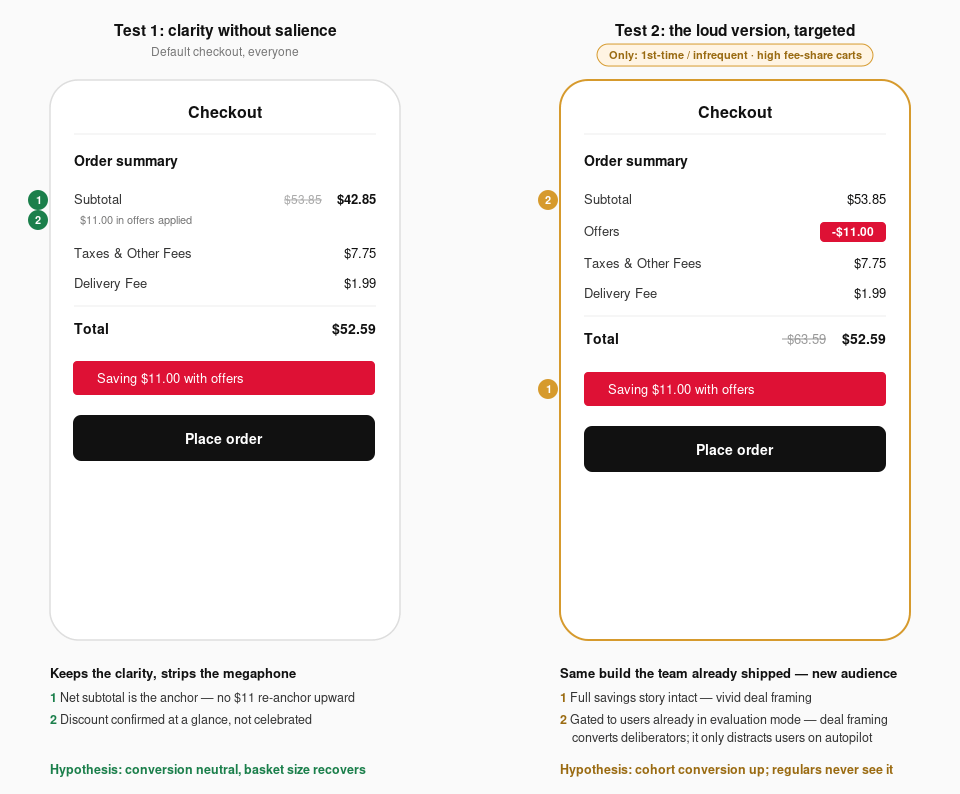
Test 1 — the quiet version. Keep the cleaner fee breakdown. Confirm the discount with a single understated line: “$11.00 in offers applied.” No strikethroughs, no banner. Let frequent users stay in autopilot mode and see if basket size recovers.
Test 2 — the loud version, but targeted. Take the same bold treatment the original team built, but show it only to users who are still in decision mode: first-time users, infrequent orderers, and small carts where the fee-to-subtotal ratio is highest. These users are not on autopilot. The deal story helps them decide. Use it there.
Both tests track basket size as a headline metric. That one change would have caught the original failure before it cost anything.
Step 1 alone is the cheapest move in this whole playbook. It would have caught the basket size drop before the team spent a quarter and $2 million learning about it the hard way.
Case Study 2. The Pricing Mistake a Fintech Caught Before Writing a Line of Code
Context
A consumer personal finance app with 10M+ users had a paid tier that was underperforming. The paywall sat inside the activation journey, conversion was weak, and the team was about to commit five weeks across three teams to testing lower price points and discount structures. The projection was tens of millions in recovered revenue, and leadership had bought in.
Problem
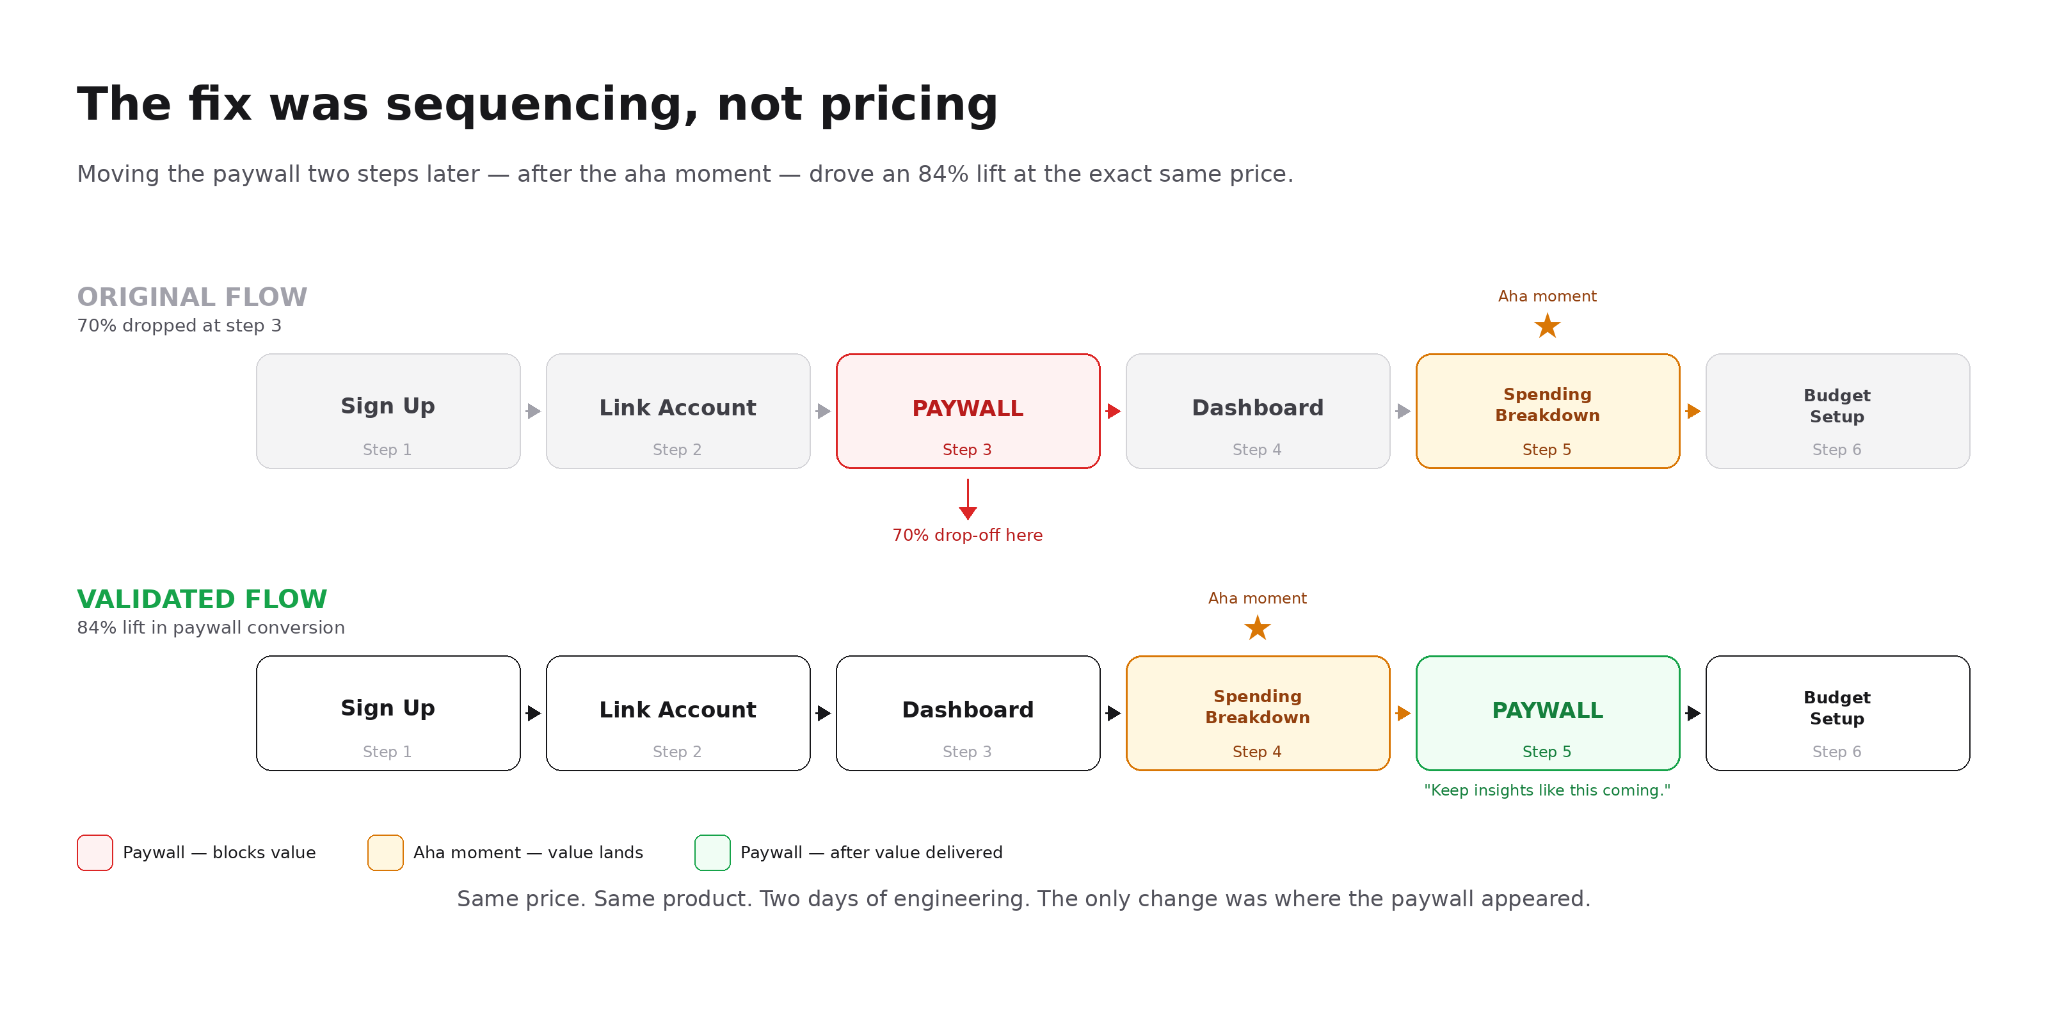
The activation funnel looked like this. A user signs up, links their first account, sees their first dashboard, and then is asked to upgrade to the paid tier to see categorized spending or to set up their first budget. The paywall sat at step 3 of a 6-step onboarding. The funnel cliff was clear. Roughly 5 in 10 users hit the paywall and dropped.
The working hypothesis was that the price was too high. Exit surveys from churned users said “too expensive.” The funnel cliff was right at the paywall. A handful of user interviews confirmed it. The team’s entire debate was about price points and discount structures. Were they at $9.99 too high? Should they try $6.99? What about a 14-day trial?
Being wrong was a public pricing change they could not quietly walk back. Once you announce a price, every customer support thread, every comparison review, and every internal forecast anchors to it. The team needed to get this right the first time.
Solution
Before committing, they rebuilt the activation-to-paywall flow as a low-fidelity simulated surface, both the current version and the proposed paid tier, and fed in their real historical behavior plus the market context (competitor pricing, the free tier baseline, the category’s average willingness to pay). Then they watched simulated users grounded in their real user distribution actually move through it.
The result flipped the project. Price was not the driver.
The drop was not happening because the number was too big. It was happening because the paywall showed up before users reached the product’s aha moment. They were being asked to pay before they had felt enough value to know what they were paying for. The same paywall, shown after that value moment, converted far better at the exact same price.
The report went further. Lowering the price actually made one group slightly worse, because a cheap price on something users did not understand read as low value, not as a deal. In a category where users equate price with trustworthiness (think personal finance, where you are handing over bank credentials), a $4.99 tier signaled “this is not serious software.” The team had been about to ship a discount that would have hurt them.
Here’s what the funnel data hid: users who made it to step 5, their first auto-categorized spending breakdown (”you spent $412 on dining out last month”), converted to paid at more than 3x the rate of users who saw the paywall first. The value wasn’t undersold. It was shown too late. The paywall was asking people to pay before the product had earned it.
The Build
What they shipped was a sequencing change, not a pricing change.
They moved the paywall from step 3 to step 5, placing it immediately after the first spending breakdown. They kept the price identical at $9.99/month. They added a single line of copy referencing what the user had just seen: “Keep insights like this coming.”
Total engineering cost: ~2 days, versus the 5 weeks of price-point testing they’d been about to run.
Impact
A seven-figure bet redirected in an afternoon, before any code got written.
When they ran the new flow live, the result matched the prediction.
Paywall conversion: 4.3% → 7.9% — an 84% relative lift, at the same price point.
Onboarding completion: 51% → 74% — because the paywall stopped ambushing new users.
Net revenue per new signup: +41%, driven entirely by placement.
Time saved: ~5 weeks of pricing experiments never had to run.
Confidence shift: the team went from an honest 40% (”we think it’s price”) to a validated 85% (”it’s sequence, not price”), before a single sprint was committed.
Learnings
The reason a user can name is rarely the reason they left: exit surveys said “too expensive,” but behavior said “I do not understand the value yet,” and only one of those is fixed by changing the price.
Validation does not just save one experiment: once the real driver was clear, the pricing project dropped down the roadmap and an activation project moved up, pointing the whole roadmap at the thing that mattered.
The highest stakes page in your product is the one you can least afford to guess on: pricing and packaging is exactly where teams guess most.
🔥 Insider Growth Playbook. Litmus 2.0
Two years ago we introduced the Litmus Framework to help PMs prioritize growth bets with confidence.
The formula was:
Litmus 1.0 = (Napkin Math Estimate) × (1 - % Resourcing Impact) × (1 - % Risk to Existing Revenue) × % Exec Buy-In Prediction
It worked because it forced napkin math and honest resourcing estimates into decisions most teams were making on gut feel alone. It helped teams rank hypotheses by confidence and move faster without gambling on the wrong things.
Litmus 2.0 does not replace that. It extends it.
AI has given product teams a new upstream signal: the ability to test how users will actually behave before engineering is committed. That signal deserves a place in the prioritization formula. So we add one variable - Hypothesis Confidence and we update one variable — Exec Buy-In — to reflect what it actually means in a world where dev resources are no longer the constraint.
Here is what changed, what stayed, and why.
Napkin Math stays. The ability to estimate KPI impact from memory is still the foundation of every prioritization decision. That muscle does not change.
Resourcing Impact stays. AI has collapsed build costs for greenfield work, but legacy codebases, cross-functional dependencies, and compliance requirements still create real constraints at most companies.
Risk to Existing Revenue stays. Any experiment on a high-traffic surface carries blast radius risk. Nothing changes here.
Exec Buy-In gets redefined. It used to measure two things: will I get dev resources, and does senior pattern recognition back this bet? Cheap builds have killed the first half. Hypothesis Confidence now covers the second. What remains is the thing Exec Buy-In was never explicitly measuring but always quietly capturing: the probability that organizational forces outside your control kill this initiative before it ships. Reorgs. Another team that owns the surface. Legal or compliance. A budget cycle that ends. A competitor launch that pulls everyone onto a response roadmap. Score it as how clear is the path for this to actually ship?
Hypothesis Confidence is new. It is your honest estimate of the probability that your assumption about user behavior is correct. Most PMs quietly treat it as 100 percent. It is almost never 100 percent. And now you have upstream tools to actually measure it before you build.
Litmus 2.0 = (Napkin Math Estimate) × (% Hypothesis Confidence) × (1 - % Resourcing Impact) × (1 - % Risk to Existing Revenue) × (% Exec Buy-In)
Hypothesis Confidence and Exec Buy-In are straight multipliers they scale the opportunity up or down. Resourcing Impact and Risk to Existing Revenue are expressed as complements — higher friction reduces the Litmus value. Same structure as Litmus 1.0. One new variable added.
Hypothesis Confidence scale
80 to 100%. You have direct behavioral evidence from past experiments, comparable surfaces, or a validated and representative simulation. Ship it.
50 to 80%. You have qualitative signal — research, interviews, funnel data — but no behavioral confirmation. Validate upstream before you build.
20 to 50%. You are working from intuition or stated user preference. This is where most teams are operating without knowing it.
Below 20%. You are guessing. Do not ship. Find a different angle first.
Note: simulation only moves your score up if the data behind it is representative. Check recency, population match, and sample size before treating simulation output as hard evidence.
Exec Buy-In scale (redefined)
80 to 100%. You own the surface, resources are committed, no obvious org blockers.
50 to 80%. One dependency you do not control, but it is manageable.
20 to 50%. Cross-team buy-in needed, legal or compliance exposure, or a shifting roadmap priority.
Below 20%. The org is likely to kill this before it ships. Solve that first.
What both case studies show in the formula
The Uber Eats checkout team had strong Exec Buy-In and strong Napkin Math. Their Hypothesis Confidence was probably 50 to 60 percent - they had funnel data, industry precedent, and qualitative research, enough to clear the 50 percent bar. But qualitative signal without behavioral confirmation is not enough when a month-long experiment on a nine-figure surface is on the line.
The fintech team was in the same position. Strong napkin math, strong exec alignment, 40 to 50 percent hypothesis confidence at best — they were working entirely from exit surveys and a funnel data. They validated upstream before building. Hypothesis Confidence moved to 85 percent.
The formula did not change the decisions. The discipline of actually scoring Hypothesis Confidence did.
Run this before your next big bet
Write the hypothesis as one sentence you can prove false, with the guardrail metric named inside it. Not “users want a smoother checkout.” Instead: “Users abandon because the fee gap feels like worse value, and closing it will lift conversion without hurting basket size.” That one sentence would have put basket size on the watch list before the Uber Eats experiment launched.
List the behavior you would see if you are right, and the behavior you would see if you are wrong. If you cannot name both, your hypothesis is not falsifiable yet. Do not move forward until you can.
Score your Hypothesis Confidence honestly. Pull the historical data. Look for the second story it tells, not just the first. If you are using simulation, check that the data is recent, representative, and large enough to be meaningful before you trust the output.
Score your Exec Buy-In honestly. Not “is leadership excited” but “how many landmines are between here and launch.”
Calculate your Litmus 2.0 value and decide. High score: ship. Medium: validate upstream before building. Low: do not ship until you have resolved what is dragging the score down — weak hypothesis, unrepresentative simulation data, or an org blocker that will kill it anyway.
Closing
The cost of shipping has collapsed. AI made the build cheap. Cursor, v0, and Claude Code mean a feature that used to take six weeks now takes a weekend. Everyone ships fast now. That is not the moat anymore.
The moat is judgment. And judgment, stripped of the vibes-based talk around “taste,” is one specific thing. It is hypothesis confidence at the moment you decide what to build.
Both case studies in this piece tell the same story from different sides. At Uber Eats, the team had an obvious hypothesis that the whole industry agreed with, never stress tested it, and burned a quarter and $2 million finding out it was wrong, learning why only after the money was spent. The fintech team in Case Study 2 had an obvious hypothesis backed by exit surveys and a funnel cliff, pressure tested it before building, and discovered the real driver was three steps upstream of where they were looking. One team treated 50 percent confidence like 90. The other measured it honestly, and redirected a bet in an afternoon.
This is what Litmus 2.0 enforces. Hypothesis Confidence is the variable most roadmaps skip. Adding it does not require a tool. It requires discipline to write the hypothesis as a sentence you can prove false, with the guardrail metric named inside it. Kohavi’s data says two out of three experiments at mature companies do not move the target metric. The single biggest lever on that number is what happens before the experiment is built, not after.
The PMs who win in the AI era will not be the ones who ship faster. They will be the ones who validate faster, before they ship, who ask “is this hypothesis even right” first instead of in the postmortem. The build was never the expensive part. The wrong hypothesis was.
Want help applying this to your product?
Let’s talk